
Companion article: Plastic and Biopolymer Evolution
Read the separate material focused analysis covering global and European market use, replacement potential, processing and end of life considerations.
What the stated data shows
Europe entered 2025 with two plastics stories moving in opposite directions. The first is an industrial competitiveness story: global production continued to expand, while European output remained well below its 2018 level and Europe lost market share. The second is a transition story: recycled and bio based feedstocks became more important, regulation created stronger future demand for recycled content, and global bioplastics capacity continued to expand. Neither story should be simplified into a claim that one material family is disappearing and another is replacing it.
How the figures were selected and checked
This article separates four types of evidence that are often mixed together in market commentary:
- Production tonnage: material actually produced during a specified year.
- Installed capacity: the maximum nominal annual output of production assets, whether used or not.
- Waste and recycling statistics: material generated, collected, sorted, recycled or treated, which uses a different system boundary from polymer production.
- Regulatory targets: future legal requirements that can influence demand but do not prove that the required capacity or material is already available.
The 2024 production figures are from Plastics Europe’s October 2025 report and cover EU27+3: the European Union, Norway, Switzerland and the United Kingdom. Plastics Europe describes the figures as preliminary estimates and notes that its historical series can be revised as definitions and data availability improve.[1]
Official packaging waste statistics come from Eurostat. The latest dataset published before 31 December 2025 covered 2023. The bioplastics figures come from the European Bioplastics and nova-Institute market update published on 2 December 2025. Legal targets are taken from EU legislation or European Commission pages rather than secondary summaries.[2][3][6]
The world expanded while Europe contracted
Global plastics production increased from 370,6 million tonnes in 2018 to 430,9 million tonnes in 2024. Over the same period, European production fell from 62,3 million tonnes to 54,6 million tonnes. The two series therefore moved in opposite directions: global output rose by 16,3%, while European output declined by 12,4%.[1]

| Year | World production | Europe EU27+3 production | European share of world output |
|---|---|---|---|
| 2018 | 370,6 Mt | 62,3 Mt | 16,8% |
| 2019 | 379,8 Mt | 60,2 Mt | 15,9% |
| 2020 | 380,6 Mt | 58,2 Mt | 15,3% |
| 2021 | 394,2 Mt | 60,2 Mt | 15,3% |
| 2022 | 400,4 Mt | 58,9 Mt | 14,7% |
| 2023 | 413,8 Mt | 54,4 Mt | 13,1% |
| 2024 | 430,9 Mt | 54,6 Mt | 12,7% |
The 2024 global increase was not a return to an old equilibrium. Asia accounted for 57,2% of world plastics production, including 34,5% in China alone. North America represented 16,3%; Europe represented 12%. The remaining production was distributed across the rest of Asia, the Middle East and Africa, Central and South America, Japan and the CIS region.[1]
Europe’s declining share is therefore caused by both sides of the equation. The region produced less than it did in 2018, while other regions added substantial capacity and output. Even if European production had remained flat, its global share would have declined because the world market expanded. The combination of contraction in Europe and expansion elsewhere accelerated the shift.
Production stabilised in 2024, but at a much lower level
European production rose by only 0,4% in 2024, from 54,4 to 54,6 million tonnes, after a sharp contraction in 2023. Stabilisation is not the same as recovery: 2024 output remained 7,7 million tonnes below 2018. The European plastics industry turnover was approximately €398 billion, down 13% from the revised 2022 figure of €457 billion. The sector included approximately 50.650 companies and 1,5 million employees.[1]
Trade data also changed direction. The EU retained a positive trade balance in value of €12,3 billion in 2024, but recorded a negative balance of 1,6 million tonnes by volume. This means that the value of exports still exceeded imports, while the physical volume of imported plastic materials and converted products exceeded exports. For the third consecutive year, Europe was no longer a net exporter by tonnage.[1]
The distinction between value and volume matters. Higher value specialised materials and products can support a positive monetary balance even while high volume commodity materials and products are imported. A region can therefore remain technically sophisticated while becoming more dependent on external sources for mass volume supply.

| Country or group | Fossil based share | Post consumer recycled share | Bio based share |
|---|---|---|---|
| Germany | 21,0% | 22,2% | 44,8% |
| Belgium | 15,4% | 3,2% | 4,7% |
| Netherlands | 11,1% | 5,2% | 1,8% |
| France | 10,9% | 8,9% | 9,3% |
| Spain | 8,8% | 12,8% | 1,0% |
| Italy | 4,4% | 14,5% | 27,3% |
| United Kingdom | 3,7% | 7,7% | 0,1% |
| Poland | 3,5% | 5,3% | 0,0% |
| Other EU27+3 | 21,2% | 20,2% | 11,0% |
Germany accounted for 21,0% of European fossil based production, 22,2% of post consumer recycled production and 44,8% of bio based production. Belgium and the Netherlands had large fossil production shares, reflecting their petrochemical clusters. Italy represented only 4,4% of fossil based output but 14,5% of recycled production and 27,3% of bio based production. These figures show that the transition does not follow the existing petrochemical map exactly.[1]
What Europe’s 15,4% circular share actually means
Plastics Europe’s circular production definition includes post consumer mechanically recycled plastics, chemically recycled plastics, bio based and bio attributed plastics, and plastics made from captured carbon. It excludes pre consumer recycled material from the headline circular share. This distinction prevents production scrap that is routinely returned to a process from being confused with recovery of products after use.[1]

In 2024, European production consisted of 43,3 million tonnes of fossil based plastics, 7,7 million tonnes of post consumer mechanically recycled plastics, 2,9 million tonnes of pre consumer mechanically recycled plastics, 0,6 million tonnes of bio based and bio attributed plastics, and approximately 0,1 million tonnes of chemically recycled plastics. The total was 54,6 million tonnes.[1]
The 15,4% circular share is therefore driven mainly by mechanical recycling. Post consumer mechanical recycling alone represented 14,1 percentage points. Bio based and bio attributed production represented 1,1%, and chemically recycled output represented 0,2%. The circular share rose partly because fossil based output fell. It should not be read as evidence that circular production expanded rapidly in absolute tonnes during 2024.
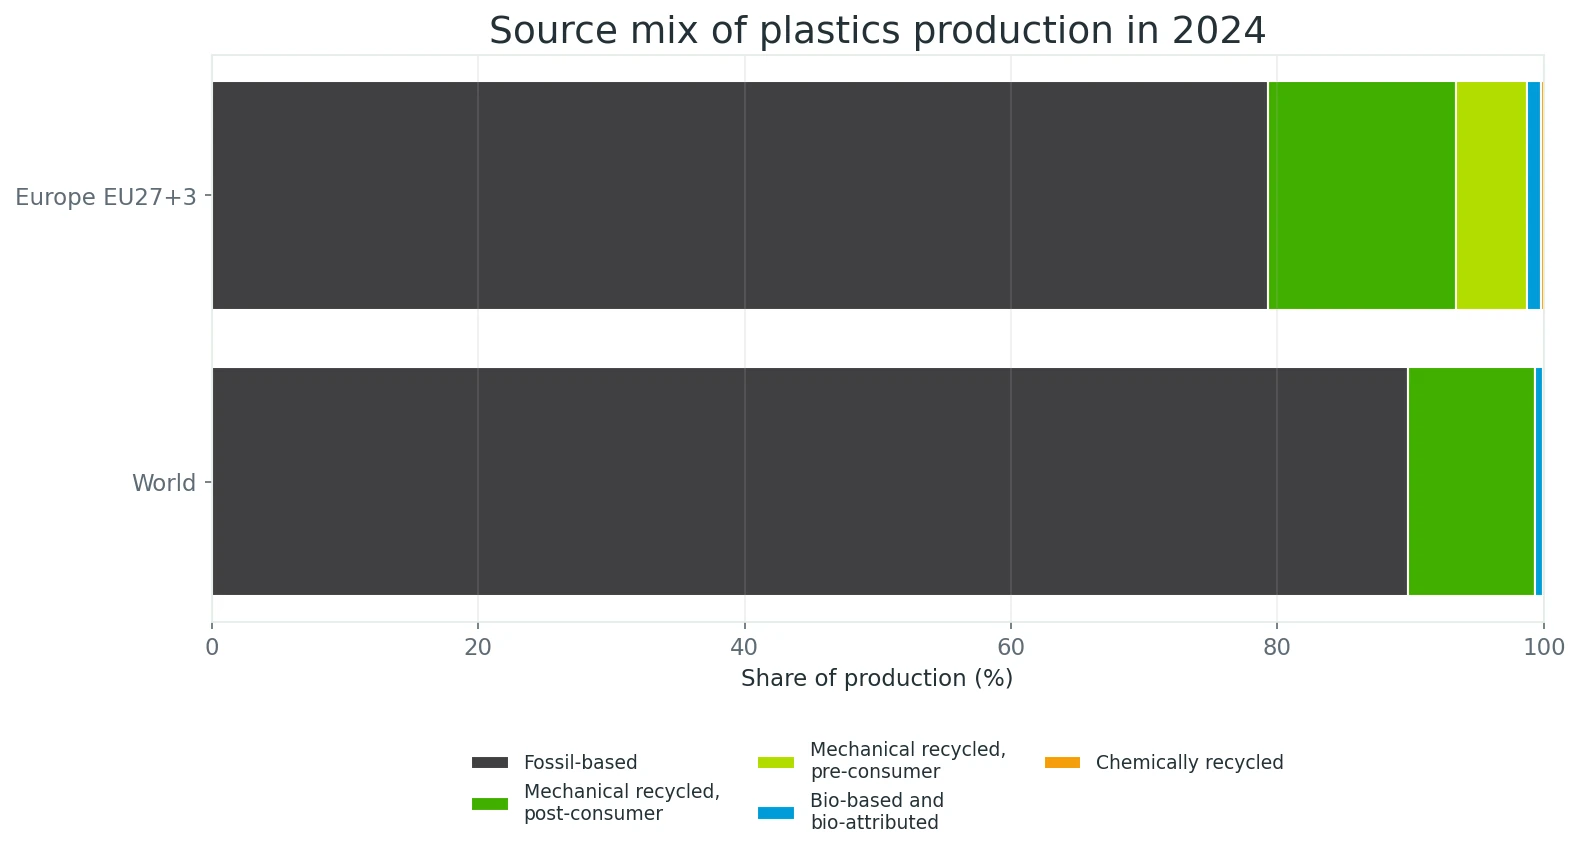
The world source mix remained more fossil dependent: 89,8% fossil based, 9,5% post consumer mechanically recycled, 0,6% bio based and bio attributed, and approximately 0,1% chemically recycled. Europe had a larger post consumer recycled share, but it also faced the economic risk that domestic recycling assets could close while legal demand for recycled content increased.
Standard polymers still carry the majority of European demand
Polypropylene, polyethylene, PVC, PET, polystyrene and polyurethane remain the central industrial polymer families. In the Plastics Europe 2024 production mix, PP represented 15,6%, LDPE and LLDPE 13,2%, HDPE and MDPE 8,2%, PVC 8,4%, PET 4,6%, PS and EPS 5,1%, and PUR 5,5%. Together these categories represented approximately 60,6% if PUR is included and 55,1% for the six largest thermoplastic families excluding PUR.[1]
| Production category | Share of European output in 2024 | Interpretation |
|---|---|---|
| PP | 15,6% | Production category in Plastics Europe 2024 data |
| Mechanical recycled, post consumer | 14,1% | Production category in Plastics Europe 2024 data |
| LDPE / LLD | 13,2% | Production category in Plastics Europe 2024 data |
| Other thermoplastics | 11,0% | Production category in Plastics Europe 2024 data |
| PVC | 8,4% | Production category in Plastics Europe 2024 data |
| HDPE / MD | 8,2% | Production category in Plastics Europe 2024 data |
| Other thermosets | 7,7% | Production category in Plastics Europe 2024 data |
| PUR | 5,5% | Production category in Plastics Europe 2024 data |
| Mechanical recycled, pre consumer | 5,3% | Production category in Plastics Europe 2024 data |
| PS / EPS | 5,1% | Production category in Plastics Europe 2024 data |
| PET | 4,6% | Production category in Plastics Europe 2024 data |
| Bio based and bio attributed | 1,1% | Production category in Plastics Europe 2024 data |
| Chemically recycled | 0,2% | Production category in Plastics Europe 2024 data |
Recycled plastics are shown as source categories rather than being assigned back to the polymer families in this graphic. A recycled PP pellet remains PP, and a recycled PET pellet remains PET, but the production statistics separate them to show feedstock transition. This is useful for circularity analysis but means the chart should not be interpreted as a conventional resin demand chart.
The persistence of standard polymers is explained by decades of process optimisation, supply chain scale, approved additives, product standards, food contact systems, durability data, conversion knowledge and recycling infrastructure. Alternative feedstocks or new polymers must compete with the complete industrial system around the incumbent material, not only with its laboratory properties.
Recycling demand is rising while the European industry is under pressure
Eurostat reported that the EU generated 79,7 million tonnes of packaging waste in 2023, equal to 177,8 kg per inhabitant. Plastic represented 19,8% of that packaging waste. Each inhabitant generated an average of 35,3 kg of plastic packaging waste and 14,8 kg was recycled. The resulting plastic packaging recycling rate was 42,1%.[3]

The 2023 rate was above the 38,2% recorded in 2013, but the amount of plastic packaging waste generated per person increased by 6,4 kg over the same decade. Recycling improved, yet total material use also increased. A higher recycling rate does not automatically produce lower waste generation.
Member state performance varied widely. Belgium reported 59,5%, Latvia 59,2% and Slovakia 54,1%, while Hungary reported 23,0%, France 25,7% and Austria 26,9%. The differences reflect collection systems, sorting, accounting, product mix, exports for treatment and local infrastructure. Eurostat also warns that the reporting methodology changed in 2020, which limits simple comparisons across the full time series.[3]
The industrial side is equally important. Plastics Recyclers Europe reported 13,5 million tonnes of installed recycling capacity in 2024, approximately 850 facilities and more than 30.000 employees. Turnover fell by 5,5%, and 2024 recorded the largest capacity contraction in the series. Preliminary 2025 information indicated a 50% increase in facility closures and a potential loss of nearly one million tonnes of capacity over three years.[4][5]
Polyolefin films and PET were particularly affected by closures in 2023 and 2024. These are also important streams for future recycled content obligations. The market therefore faced a structural contradiction at the end of 2025: regulation was creating future demand, while weak current economics were reducing domestic supply capacity.
Regulation is moving from general recycling goals to material specific obligations
The Packaging and Packaging Waste Regulation, Regulation (EU) 2025/40, entered into force on 11 February 2025 and applies from 12 August 2026. It replaces the older directive with directly applicable EU rules covering design, recyclability, recycled content, reuse, labelling, waste prevention and producer responsibilities.[6]
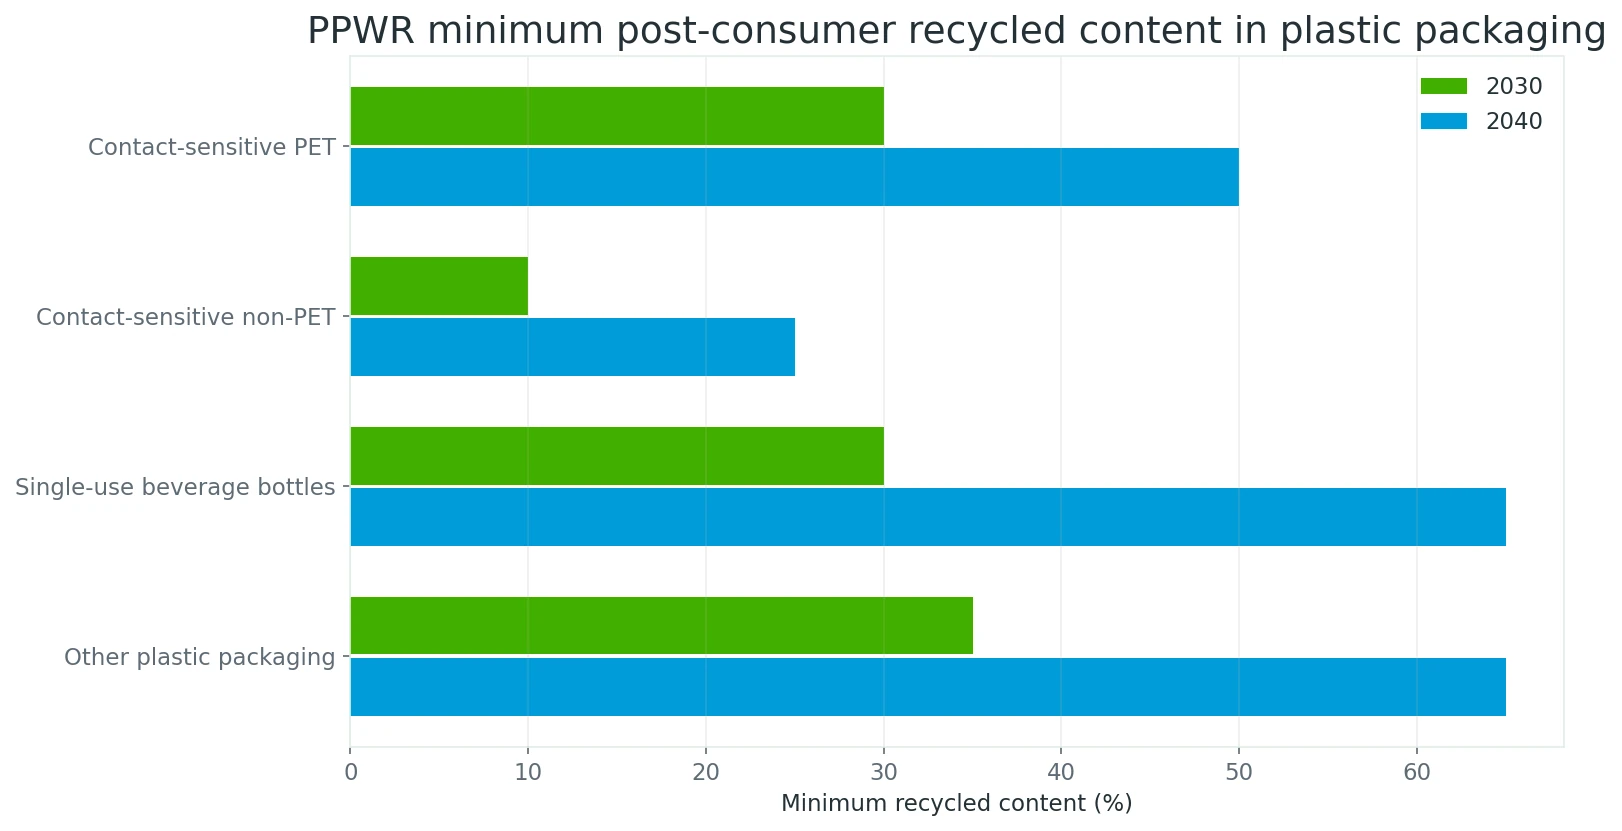
For 2030, the regulation establishes minimum post consumer recycled content of 30% for contact sensitive PET packaging, 10% for contact sensitive non PET plastic packaging, 30% for single use plastic beverage bottles and 35% for other plastic packaging. The 2040 values rise to 50%, 25%, 65% and 65% respectively, subject to specified exceptions and implementation rules.[6]
The regulation also requires packaging to be designed for recycling and introduces recycling at scale requirements. It sets packaging waste prevention targets per inhabitant relative to 2018 of at least 5% by 2030, 10% by 2035 and 15% by 2040. These measures affect both material selection and package design.
The Single Use Plastics Directive created an earlier demand signal for beverage bottles: 25% recycled plastic in PET beverage bottles from 2025 and 30% in all plastic beverage bottles from 2030. It also sets a 77% separate collection target for bottles by 2025, increasing to 90% by 2029.[7]
PET beverage bottles require 25% recycled plastic; separate collection target for plastic bottles is 77%.
Regulation (EU) 2025/40 becomes EU law.
At least 50% of plastic packaging waste under the existing packaging framework.
Most provisions begin to apply after the transition period.
All packaging must meet recyclability requirements; plastic packaging receives category specific recycled content targets.
Packaging must be recyclable at scale, not only theoretically designed for recycling.
PPWR targets rise substantially for all four plastic packaging categories.
On 23 December 2025, the European Commission adopted a communication on accelerating the circular economy through a plastics pilot. The timing is significant: it recognised that circularity is not only an environmental objective but also a competitiveness, raw material security and industrial resilience issue.[11]
Evidence based scenarios, not a single forecast
The data available at the end of 2025 supports several conclusions, but it does not justify a precise prediction for European production in 2030. Energy prices, trade policy, demand, investment, recycling economics, implementation of PPWR and global capacity decisions can change the result.
Scenario 1: managed transition with European investment
In this scenario, recycled content demand is matched by collection, sorting and recycling investment. European recyclers remain viable, imported material is subject to equivalent verification, and converters obtain predictable specifications. Bio based capacity grows in higher value applications, and drop in grades expand where they fit existing infrastructure. Europe stabilises its industrial base while increasing circular share.
Scenario 2: regulation without competitive supply
Targets increase, but energy and operating costs keep European recycling and polymer assets uncompetitive. Recyclers close, converters rely more heavily on imported virgin and recycled feedstock, and Europe meets some product obligations without rebuilding domestic production. Circularity improves on paper but strategic dependence grows.
Scenario 3: fragmented material substitution
Companies move quickly into paper, compostable polymers, bio based materials and multilayer solutions without aligned sorting and end of life systems. Product level claims increase, but contamination and incompatible local waste routes reduce system efficiency. This scenario can be avoided through standards, clear labels, design for recycling and application specific trials.
What is more certain
- Standard polymers will remain the majority of the market through 2030 because their current scale is hundreds of millions of tonnes.
- Recycled content will become more important in packaging and other regulated applications.
- Bioplastics capacity will grow faster in percentage terms than total plastics production, but from a very small base.
- Bio PP, bio PE, PLA and PHA are expected to receive substantial new capacity.
- Traceability, certification, sorting compatibility and data quality will become more important commercial requirements.
- European competitiveness will determine whether circular demand is supplied by European assets or imported materials.
Europe is moving towards a mixed material, data intensive plastics economy
By December 2025, the evidence did not show a rapid replacement of standard polymers. It showed a much more complex transition. Global plastics production continued to grow. European production and market share declined. Mechanical recycling became a structural feedstock, but the recycling industry entered a serious economic downturn. Regulation created stronger future demand for recyclability and recycled content. Bioplastics capacity grew quickly in percentage terms but remained less than 1% of the global plastics system.
The most credible path is therefore not a competition in which one material wins. It is a controlled portfolio approach: reduce unnecessary material, reuse where practical, improve recyclability, use verified recycled content, introduce bio based feedstock where it produces a life cycle benefit, and use biodegradable or compostable polymers only where the collection and treatment system supports them.
For processors, the transition will be won through material knowledge and process control. The companies that can test, document and scale new formulations reliably will be better prepared than companies that rely only on supplier claims or broad market labels.
Preparing to test recycled plastics, bio based polymers or new blends?
Green Extrusion Technology supplies laboratory extruders, blown film units and recycling equipment for controlled material and process trials.
Sources and data references
All sources were publicly accessible. Production, conversion, capacity, waste and regulatory figures are identified according to their original scope and year.
October 2025. 2024 preliminary world and EU27+3 production, source mix, polymer mix, country shares, economic indicators and trade.
December 2025. Global and European bioplastics capacity, material mix, applications and utilisation.
22 October 2025. 2023 EU packaging waste, plastic packaging generation and recycling.
12 November 2025. 2024 recycling capacity, turnover and closures.
11 September 2025, revised 9 November 2025. Preliminary 2025 closure and capacity loss outlook.
22 January 2025. PPWR recycled content, recyclability, prevention and reuse requirements.
Current policy page, rules in force by December 2025. Bottle collection and recycled content requirements.
Policy framework adopted 30 November 2022. Definitions, appropriate uses, standards and policy cautions.
2020 briefing. End of life conditions, labelling, recycling interaction and application specific benefits.
2022. Cost, market share, sustainability criteria, sourcing and certification challenges.
23 December 2025. End of-2025 policy direction for circular plastics and secondary raw materials.
March 2024, based mainly on 2022 estimates. Detailed circular flow definitions, converter demand and waste management context.