

Companion article: European Plastics Statistics and Market Trends
Read the separate market article for production, European competitiveness, recycling, regulation and outlook data.
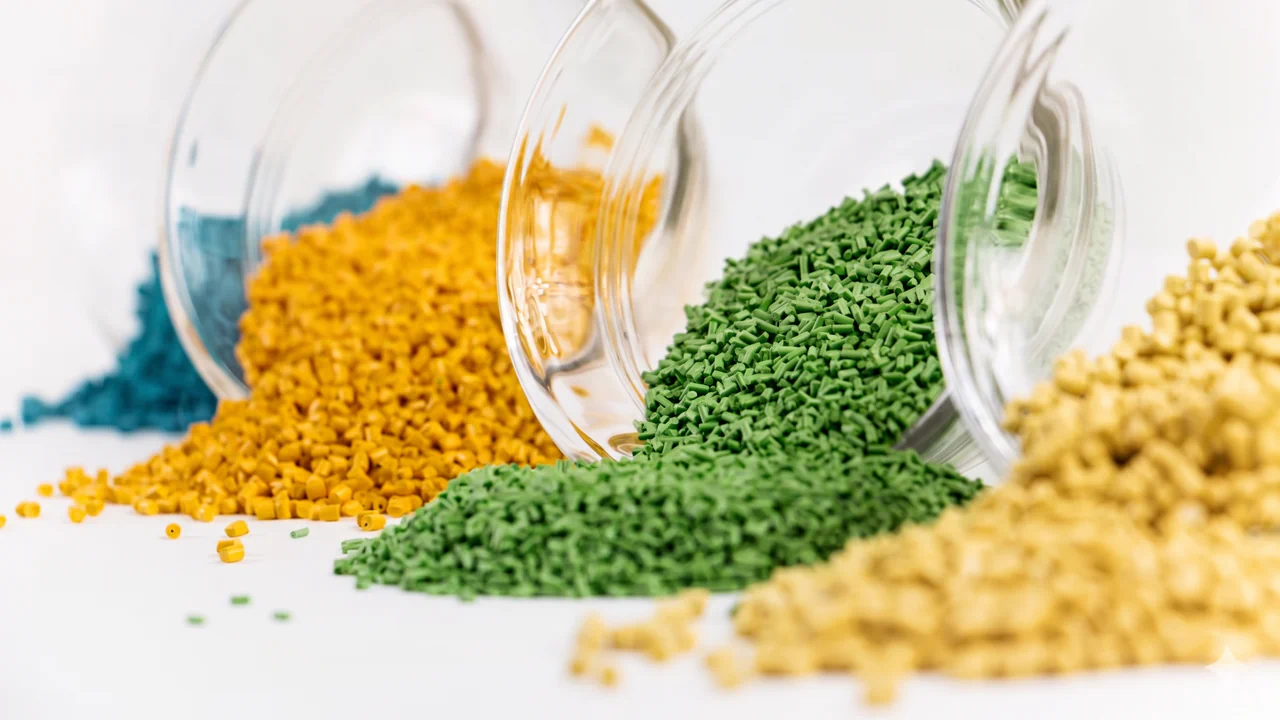
Polymer pellets can look similar and behave very differently in the extruder
Virgin polymers, recycled compounds and bio based grades can differ in drying, rheology, melt strength, thermal stability and process window. Green Extrusion Technology builds laboratory extrusion equipment for controlled material trials before production scale decisions are made.
How conventional plastics and bioplastics are used worldwide
Conventional plastics operate at a completely different scale from bioplastics. Plastics Europe estimated global plastics production at 430,9 million tonnes in 2024. The OECD estimated global plastics use, including fibres and additives, at 460 million tonnes in 2019. These are different measures and years, but both show a market measured in hundreds of millions of tonnes.
The OECD found that packaging, construction and transport together represented more than 60% of global plastics use in 2019. Other major markets included textiles, consumer and institutional products, electrical and electronic equipment, machinery and tyres. Packaging has a high material throughput because products have short service lives, while construction and transport retain large quantities of plastics in long lived products.

Global bioplastics production capacity was 2,31 million tonnes in 2025, while actual production was 1,67 million tonnes. The market therefore operated at an average of 72% of capacity. Packaging remained the largest bioplastics market, representing 41,3% of capacity. Flexible packaging accounted for 26,6% and rigid packaging 14,7%. Fibres represented 21,3%, consumer goods 14,0%, automotive and transport 10,3%, agriculture and horticulture 4,7%, electrical and electronics 3,4%, functional applications 1,2% and other applications 3,7%.
Conventional plastics and bioplastics in Europe
Plastics Europe estimated that converters in the EU27+3 processed 54,1 million tonnes of plastics into products and components in 2022. Packaging represented 39,0% of the total, building and construction 22,9%, automotive 8,3%, electrical and electronics 5,7%, agriculture 4,4%, houseware, leisure and sports 4,1%, and other applications 15,6%.

The European Bioplastics market update reported approximately 0,33 million tonnes of EU27+3 bioplastics capacity in 2025, forecast to rise to approximately 0,80 million tonnes in 2030. The published update provides the European capacity split by polymer, not an equivalent European application split. It is therefore not responsible to invent a European packaging or automotive percentage for bioplastics.
The 2025 European capacity mix was concentrated in PBAT, bio based polyamides and starch compounds. The 2030 forecast shifts strongly towards bio PP, bio PE, PLA and PHA. European Bioplastics also reported average European utilisation of 73% of capacity in 2025.
A fast growth rate from a very small industrial base
European Bioplastics and the nova-Institute estimated global bioplastics production capacity at 2,31 million tonnes in 2025. This was approximately 0,5% of the 430,9 million tonnes of global plastics production reported for 2024. Capacity was forecast to reach 4,69 million tonnes in 2030, more than double the 2025 level.[2]

| Year | Bio based, not biodegradable capacity | Bio based, biodegradable capacity | Total capacity |
|---|---|---|---|
| 2024 | 1,050 Mt | 0,974 Mt | 2,024 Mt |
| 2025 | 1,229 Mt | 1,082 Mt | 2,311 Mt |
| 2026 | 1,257 Mt | 1,506 Mt | 2,763 Mt |
| 2027 | 1,484 Mt | 1,852 Mt | 3,336 Mt |
| 2028 | 1,855 Mt | 2,238 Mt | 4,093 Mt |
| 2029 | 2,255 Mt | 2,382 Mt | 4,637 Mt |
| 2030 | 2,255 Mt | 2,437 Mt | 4,692 Mt |
The capacity forecast implies an average annual increase of approximately 15,2% between 2025 and 2030. However, actual production was lower than capacity. The 2025 market update reported 1,67 million tonnes of production, equal to 72% utilisation of the 2,31 million tonnes of installed capacity. Utilisation varied from 28% to 100% by polymer, and Europe averaged 73%.[2]
Packaging remained the largest bioplastics application in 2025. Flexible packaging represented 26,6% and rigid packaging 14,7%, together equal to 41,3% or approximately 0,95 million tonnes of capacity. Fibres represented 21,3%, consumer goods 14,0%, and automotive and transport 10,3%.[2]

The 2030 forecast changes the mix. Rigid packaging rises to 24,8%, flexible packaging to 27,6%, agriculture to 6,7%, while the percentage shares of fibres and automotive decline even though their absolute capacity does not necessarily fall. A smaller percentage can still represent more tonnes when the total market doubles.
European capacity is expected to grow and change composition
The 2025 European Bioplastics data placed EU27+3 bioplastics capacity at approximately 0,33 million tonnes, forecast to rise to approximately 0,80 million tonnes by 2030. This is an increase of about 142% in five years. The forecast growth is concentrated in bio PP, bio PE and PHA, with additional PLA capacity also expected.[2]

In 2025, the European capacity mix was concentrated in PBAT, bio based polyamides and starch compounds. By 2030, the forecast gives bio PP the largest share, followed by bio PE, PBAT, bio PA, starch compounds and PLA. PHA remains smaller in Europe than in the global forecast but grows materially from its 2025 base.
Plastics Europe’s separate 2024 production estimate reported only 0,3 million tonnes of European bio based plastics production, excluding bio attributed output at country level because of data limitations. Germany represented 44,8% and Italy 27,3% of that production. These figures should not be forced into a direct comparison with the European Bioplastics capacity data because the organisations use different definitions, scopes and methodologies.[1][2]
The industrial opportunity is therefore real but limited in current scale. Europe can develop specialised technology, higher value grades, compounding knowledge, certification and application engineering without becoming the largest global producer of every material. The risk is that innovation and equipment knowledge remain European while commodity scale production is built elsewhere.
Bio based, biodegradable, compostable and recycled are not synonyms
The word bioplastics is convenient but imprecise. European policy distinguishes the origin of the carbon from the behaviour at end of life.[8][9]
The European Commission states that bio based plastics are not necessarily biodegradable or compostable. Biodegradable plastics can be made from biological or fossil resources. The Commission recommends biodegradable and compostable plastics for applications where reduction, reuse or material recycling are not feasible and where the intended end of life route provides a clear benefit.[8]
The European Environment Agency similarly concludes that biodegradable and compostable plastics can be useful in specific systems, such as accepted food waste collection bags or agricultural mulch films, but are not a general solution to plastic pollution. Degradation depends on temperature, moisture, oxygen, microorganisms and time. In unsuitable conditions, a product may degrade slowly, not fully, or fragment.[9]
Which biopolymers can replace or perform similarly to standard polymers?
The answer depends on whether the proposed material is a true drop in polymer, a different polymer that can perform a similar function, or a completely different material system. The table separates these cases so that chemical identity is not confused with marketing language.
| Standard polymer or application | Bio based or alternative route | Type of relationship | Typical global uses | Important limits |
|---|---|---|---|---|
| LDPE, LLDPE and HDPE | Bio PE | Drop in equivalent with the same polyethylene identity | Films, bags, bottles, caps, containers, pipes and liners | Can normally use established PE processing and recycling routes. The bio based claim concerns feedstock origin, not biodegradability. |
| PP | Bio PP | Drop in equivalent with the same polypropylene identity | Packaging, fibres, automotive parts, appliances, sheet and technical mouldings | The polymer remains durable and not biodegradable. Supply scale and certification are the main differences. |
| PET | Partly bio based PET | Drop in equivalent when the final polymer remains PET | Beverage bottles, trays, films, strapping and fibres | Can enter PET processing and recycling routes when specifications are met. Drying and molecular weight remain critical. |
| PET | PEF | Alternative polyester, not a drop in replacement | Bottles, films and barrier packaging | Can offer strong gas barrier performance, but requires separate process validation, sorting and recycling assessment. |
| PS and PET in selected rigid products | PLA | Functional alternative for selected products | Thermoformed trays, cups, rigid packaging, fibres, coatings and some films | Requires drying and a controlled thermal window. Heat resistance and impact performance may need modifiers. |
| PE and PP films in selected applications | PHA, PBAT, PBS and starch blends | Application specific biodegradable or compostable alternative | Food waste bags, agricultural films, coatings and selected flexible packaging | The intended composting or biodegradation environment must be defined. These materials are not universal film replacements. |
| PA engineering polymers | Bio PA11, PA610 and related grades | Bio based engineering alternative | Automotive, tubing, films, electrical and technical components | Can retain engineering performance, but moisture conditioning, drying and grade selection remain important. |
| PUR | PUR made partly with bio based polyols | Partly bio based version within the same broad polymer family | Foams, insulation, coatings, adhesives and elastomers | Bio based content does not make crosslinked PUR biodegradable or easy to recycle. |
| PS foam and selected plastic packaging | Moulded fibre, cellulose and coated paper | Non plastic material substitution | Protective packaging, trays and dry product packaging | Barrier coatings, moisture, weight, product protection and recycling compatibility must be assessed together. |
| PVC and other durable polymers | No single universal biopolymer equivalent | Application redesign rather than direct substitution | Pipes, profiles, cables, flooring, construction and medical products | Performance, fire behaviour, durability, additives, regulation and service life make broad replacement unrealistic. |
Extrusion equipment for polymer and biopolymer development
Use small material quantities to compare formulations, define a processing window and understand how a new grade behaves before committing production capacity.
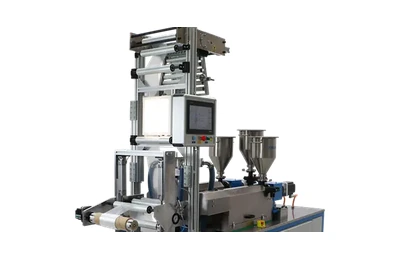
Laboratory extruders
For material testing, teaching, product development, mono layer and multilayer extrusion trials.
See laboratory extruders →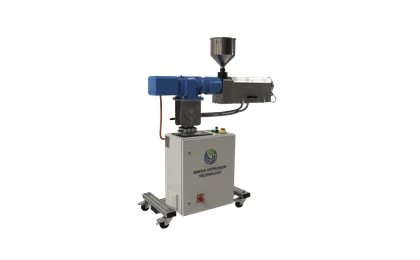
MULTI-X compact extruders
Compact 18 to 30 mm extruders for flexible development work, profiles, filament and specialised small scale processing.
See MULTI-X extruders →Standard polymers versus bio based and non plastic alternatives
The correct comparison is not simply plastic versus bioplastic. There are at least four different substitution routes:
- Recycled content in the same polymer: recycled PE replacing part of virgin PE, or recycled PET replacing virgin PET.
- Drop in bio based versions: bio PE, bio PP or bio PET with the same polymer identity as the fossil version.
- New polymer chemistry: PLA, PHA, PEF, PBS, starch compounds and other materials that require separate processing and end of life validation.
- Non plastic systems: paper, board, moulded fibre, metals, glass, wood, reusable systems or product redesign.
| Standard material or family | Typical strengths and uses | Alternative routes | What must be checked |
|---|---|---|---|
| LDPE, LLDPE and HDPE | Flexible films, bottles, caps, pipes, liners and general packaging | Bio PE is chemically identical when produced as a drop in grade. Recycled PE can replace part of virgin input when contamination, odour and property loss are controlled. PLA, PHA and paper based structures can replace PE only in selected applications. | Bio PE can run in established PE processes and recycling streams. PLA and PHA have different drying, thermal, rheological and end of life requirements. |
| PP | Rigid packaging, fibres, automotive parts, appliances, sheet and technical mouldings | Bio PP is a drop in route with the same polymer identity. Recycled PP is increasingly important. PHA, PLA blends and natural fibre composites can address specific products but are not general substitutes. | A bio based feedstock does not change PP processing or biodegradability. Bio PP remains a durable, not biodegradable polyolefin. |
| PET | Beverage bottles, trays, films, strapping and fibres | Bio PET can be partly bio based and chemically identical. PEF can be fully bio based and offers a different barrier profile. Recycled PET has the most mature food contact bottle to bottle route in Europe. | PET, bio PET and PEF require disciplined drying. PEF is a separate polymer and must not be assumed compatible with PET recycling without validated sorting and recycling routes. |
| PS and EPS | Rigid food packaging, protective packaging, insulation and disposable products | Moulded fibre, cellulose, PLA foams, starch compounds and reusable systems can replace some applications. | Substitution may change moisture resistance, impact performance, heat resistance, weight and recycling infrastructure. |
| PVC | Pipes, profiles, cables, flooring, medical products and construction | Polyolefins, TPEs, bio attributed feedstock, wood plastic composites and non plastic materials can replace selected products. | PVC combines a distinctive additive system, fire performance and long service life. There is no single universal bio based replacement. |
| PA | Engineering components, films, automotive, electrical and high performance applications | Bio based PA11, PA610 and related grades can reduce fossil feedstock dependence while retaining engineering performance. | Bio based polyamides remain durable engineering plastics, not automatically biodegradable. Moisture conditioning and drying remain critical. |
| PUR | Flexible and rigid foams, insulation, coatings, adhesives and elastomers | Bio based polyols can reduce fossil content. Recycled feedstock and alternative insulation systems can address some uses. | A partly bio based PUR is normally still a crosslinked or durable polymer with difficult end of life recovery. The full formulation and application must be assessed. |
| PLA | Rigid packaging, fibres, thermoforming, coatings, some films and food service products | A bio based polymer with industrial compostability options for certified products. It can replace PS, PET or PE in selected applications, not as a universal drop in. | Requires drying, has a narrower processing window than common polyolefins, and may need modifiers for heat, impact or blown film melt strength. |
| PHA | Speciality packaging, coatings, agricultural and medical applications | A family of bio based and biodegradable polymers with strong growth forecasts. | Properties vary widely by PHA type. Cost, scale, thermal stability and process window control remain decisive. |
| Starch compounds, PBS and PBAT systems | Compostable bags, food waste liners, films, agricultural and selected packaging uses | Useful where collection with bio waste or controlled biodegradation provides a system benefit. | Biodegradable does not necessarily mean bio based. Certification and local waste treatment acceptance are essential. |
| Paper, board, moulded fibre and regenerated cellulose | Dry food packaging, trays, protective packaging, labels and selected flexible structures | Can reduce plastic use in suitable applications and can be combined with coatings or thin polymer barriers. | Barrier layers, wet strength, product loss, coating recyclability, weight and transport impacts must be included in the comparison. |
A drop in bio based polymer is technically the simplest substitution because the polymer molecule is the same. Bio PE remains polyethylene; bio PP remains polypropylene. Processing conditions and recycling identity can therefore remain close to the conventional grade. The environmental claim concerns feedstock origin, not biodegradability.
New polymers can deliver different functions. PLA offers stiffness, clarity and bio based content. PHA offers a family of biodegradable options. PEF can offer strong gas barrier properties. Starch compounds can support certified compostable products. These materials are not automatically superior in every environmental category, and they are not universal replacements for PE, PP, PET, PVC or engineering polymers.
The 2022 European Commission study found that bio based plastics were commonly 20% to more than 100% more expensive than fossil based alternatives because of feedstock costs, smaller plants and less mature supply chains. Prices change by grade, region and contract, so the range is not a quotation for 2025. It remains useful as an explanation for the limited market share and the importance of scale.[10]
Alternative feedstocks change extrusion risk before they change market share
A converter can encounter major processing differences even when the new material represents a small share of the total market. Laboratory and pilot scale testing is valuable because material behaviour is controlled by molecular weight, branching, crystallinity, moisture, additives, contamination, recycled history and thermal degradation, not only by the marketing category.
| Technical factor | Standard polymer reference | What changes with recycled, bio based or biodegradable grades |
|---|---|---|
| Moisture control | Often low for PE and PP; very important for PET, PA and some engineering polymers | Critical for PLA, PEF, bio PET, bio PA and many hydrolysable polymers. Drying conditions must follow the supplier data. |
| Thermal window | Well established and generally broad for commodity polyolefins | Some alternatives have narrow thermal stability windows. Residence time and dead spots become more important. |
| Melt strength | LDPE and tailored PE grades are strong references for blown film | PLA, PHA and blends may need chain extenders, branching, modifiers or specialised screw and die conditions. |
| Rheology | Large industrial databases and proven screw designs | Alternative grades can show stronger batch variation, shear sensitivity or different extensional behaviour. |
| Additives | Mature stabiliser, slip, antiblock, colour and processing aid systems | Additives can change compostability, recycling compatibility, food contact status and bio based content claims. |
| Recycling | Established streams for PET and polyolefins, although quality and collection vary | Drop in bio PE, bio PP and bio PET can use the same routes. PLA, PHA and compostable blends need separate validation. |
| Certification | Material declarations, food contact, recycled content and quality systems | Additional claims may include bio based carbon, industrial compostability, soil biodegradation and chain of custody certification. |
| Scale up | Production behaviour is usually well documented | Laboratory extrusion is especially valuable because small formulation changes can materially affect processing and final properties. |
Drying and hydrolysis
PE and PP normally tolerate low moisture levels without chain scission. PET, PA, PLA, PEF and several biodegradable polyesters are different. Moisture at processing temperature can reduce molecular weight, lower viscosity, weaken film or sheet, and create unstable extrusion. Supplier drying conditions, dew point, residence time and re exposure after drying must be treated as process parameters.
Melt strength and blown film
LDPE has long chain branching and a well established combination of melt strength and extensional behaviour for blown film. Some PLA, PHA and recycled polymer grades have lower or less stable melt strength. Film production may require molecular weight control, reactive extrusion, chain extenders, blending, modified screw geometry, lower residence time, careful die design and adapted cooling.
Recycled material variability
Recycled pellets can vary in melt flow rate, odour, colour, moisture, gels, black spots, contamination and stabiliser history. A certificate of analysis is necessary but may not describe the full behaviour in a thin film or demanding multilayer structure. Incoming quality control and small scale extrusion trials reduce the risk of disrupting a production line.
Certification and claims
Material identity, recycled content percentage, bio based carbon content, mass balance allocation, industrial compostability and food contact status are different claims with different evidence. A company should not use one certificate as proof of another characteristic. The final product, not only the raw pellet, may need testing and certification.

Study blown film behaviour before moving to production
Evaluate bubble stability, cooling, drawdown, thickness behaviour, film appearance and winding with controlled laboratory trials. This is particularly useful when comparing recycled materials, bio based polymers and new blends with established PE formulations.
Why material origin alone cannot prove sustainability
Bio based feedstock can reduce dependence on fossil carbon and can lower life cycle greenhouse gas emissions, but the result depends on feedstock, agricultural practices, energy, process efficiency, land use change, product life, recycling and disposal. The European Commission therefore recommends life cycle assessment rather than a simple bio based label.[8][10]
Important trade offs include:
- Climate: renewable carbon can reduce fossil greenhouse gas emissions, but cultivation, fertiliser, processing energy and land use change can offset part of the benefit.
- Land and biodiversity: primary crops can compete with food, feed or ecosystems. Residues, wastes, side streams and sustainably sourced biomass can reduce this pressure.
- Water and nutrients: some agricultural feedstocks require irrigation, fertiliser or pesticides.
- Product efficiency: a heavier or less effective alternative can increase material use or product loss. Packaging must be assessed together with the product it protects.
- End of life: a recyclable drop in polymer may fit existing systems better than a compostable polymer in a region without organic recycling infrastructure.
- Litter: biodegradability is not permission to litter. Open environments do not provide uniform industrial composting conditions.
The EEA places material recycling first in the circular hierarchy for most plastics. Compostable plastics can provide a system benefit where they help collect food waste or where separation from organic matter is unrealistic. The decision depends on local collection and treatment, not only the polymer certificate.[9]
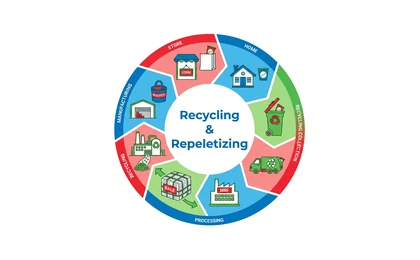
From production scrap back to reusable pellets
Green Extrusion Technology supplies compact recycling and repelletizing systems for clean production scrap and material development. Reprocessing trials can help identify how filtration, degassing, residence time and thermal history affect the next extrusion cycle.
What processors, recyclers and equipment buyers should do
For Green Extrusion Technology, this market direction reinforces the role of small scale extrusion, film and recycling equipment. A laboratory line does not predict every production issue, but it allows a company to compare materials using controlled conditions, small quantities and measurable process data.
Questions to answer before selecting an alternative material
- What function must the product deliver: barrier, stiffness, flexibility, heat resistance, impact, transparency, sealability, durability or biodegradation?
- Is the objective lower fossil feedstock, higher recycled content, recyclability, compostability, lower product weight, reuse or a verified life cycle reduction?
- Does the alternative keep the same polymer identity, or does it create a new sorting and recycling requirement?
- What is the local collection and treatment route in every target market?
- What certification applies to the raw material and to the final product?
- What drying, screw, die, cooling and downstream changes are required?
- Can the product be made thinner, lighter or reusable instead of changing material?
- Does the alternative increase product loss, transport weight, energy consumption or contamination risk?
- Is supply available at the required scale, quality and price?
- Has the formulation been tested on representative equipment before production launch?
What is likely to change before 2030
Standard polymers will remain the majority of the global market because their current scale is measured in hundreds of millions of tonnes. Bioplastics capacity is expected to grow much faster in percentage terms, but from a base of only 2,31 million tonnes in 2025.
The most credible near term growth routes are not identical. Bio PE, bio PP and partly bio based PET can reduce fossil feedstock while preserving familiar polymer identity. PLA, PHA, PEF and compostable blends can create new functions and end of life options, but require separate processing, product and waste system validation.
In Europe, the strongest announced capacity growth is expected in bio PP, bio PE and PHA. This creates opportunities for material development, compounding, film, sheet, injection moulding and laboratory process testing. It does not remove the need for recycling, reduction and reuse of standard polymers.
Tell us about your material and your application
Green Extrusion Technology designs and supplies laboratory extruders, compact extruders, blown film units and recycling equipment for plastics, recycled materials and biopolymers. Tell us what you want to test or produce, and we will help you identify the most suitable machine configuration.
Sources and data references
All sources were publicly accessible. Market capacity, production, application and technical definition data are identified according to their original scope.
October 2025. 2024 preliminary world and EU27+3 production, source mix, polymer mix, country shares, economic indicators and trade.
December 2025. Global and European bioplastics capacity, material mix, applications and utilisation.
22 October 2025. 2023 EU packaging waste, plastic packaging generation and recycling.
12 November 2025. 2024 recycling capacity, turnover and closures.
11 September 2025, revised 9 November 2025. Preliminary 2025 closure and capacity loss outlook.
22 January 2025. PPWR recycled content, recyclability, prevention and reuse requirements.
Current policy page, rules in force by December 2025. Bottle collection and recycled content requirements.
Policy framework adopted 30 November 2022. Definitions, appropriate uses, standards and policy cautions.
2020 briefing. End of life conditions, labelling, recycling interaction and application specific benefits.
2022. Cost, market share, sustainability criteria, sourcing and certification challenges.
23 December 2025. End of-2025 policy direction for circular plastics and secondary raw materials.
March 2024, based mainly on 2022 estimates. Detailed circular flow definitions, converter demand and waste management context.
Global plastics use by application, polymer mapping and long term market context.